

Wi-Fi Heatmap Planner
Draw your rooms at their measured sizes, or upload a floor plan and trace it, and say what each wall is made of. Drop access points on it and watch the coverage change as you move them, on every band and every floor. Plan channels so neighbouring access points stop sharing airtime, and calibrate the prediction with readings from your own phone.
1 Plan and coverage
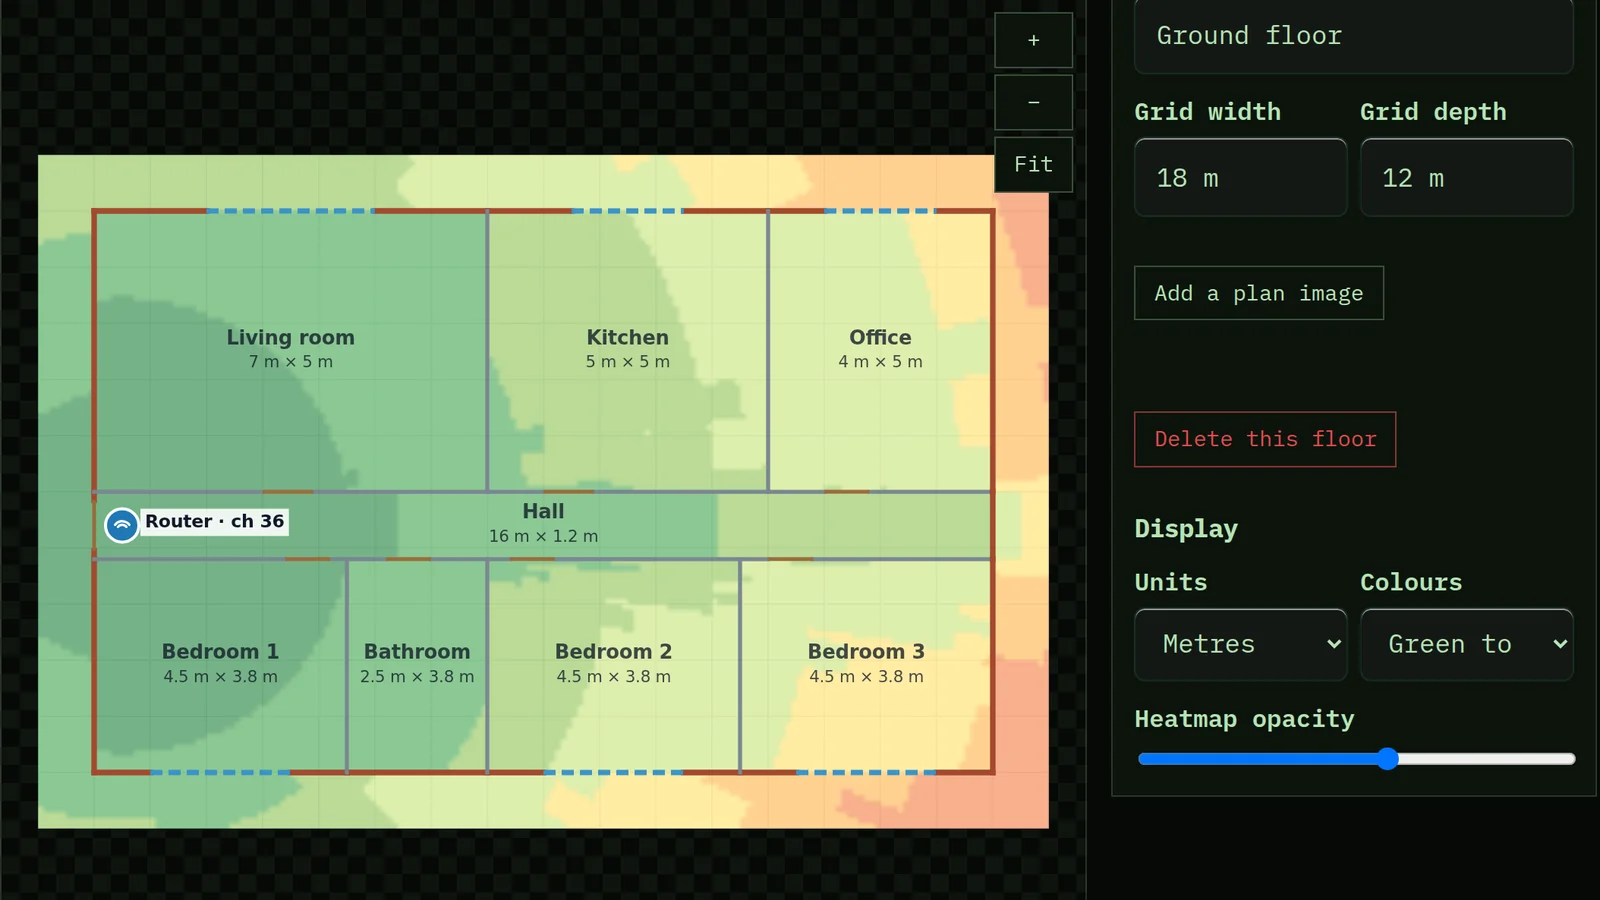
Draw rooms at their measured sizes or trace an uploaded plan, add doors, windows and walls, place access points, and switch between signal, serving access point and channel-sharing views for each band.
This browser will not keep saved work — storage is blocked, or this is a private window.
2 Channel plan
Every radio's channel and width, which pairs will share airtime, and a planner that picks channels from how strongly each access point hears the others.
This browser will not keep saved work — storage is blocked, or this is a private window.
3 Calibrate
Compare the prediction with readings you took, fit the model to your building, and replace computed wall losses with ones you measured.
This browser will not keep saved work — storage is blocked, or this is a private window.
4 Take it away
A heatmap image, a printable design report, and the access-point and channel table as CSV.
This browser will not keep saved work — storage is blocked, or this is a private window.
The plan, its images and your readings are saved in this browser, and in your account if you are signed in. Nothing is sent anywhere to compute the coverage.
No floor plan is needed. Rooms drawn at the sizes a tape measure gives are enough for the model, which only needs where walls are and what they are made of. Where two rooms meet, the wall between them counts once, and a door or window replaces the stretch of wall it sits in. Good sources of a plan to trace are a property listing's floor plan, a phone room-scanning app, the fire evacuation plan on a wall, or the builder's or landlord's drawings.
A plan photographed at an angle is straightened from its four corners. Its true shape is worked out from the photo's perspective (Zhang and He's method for photographed rectangles), which is exact on an uncropped phone photo; typing the real width and depth of what the corners outline makes it exact on any photo and sets the scale in the same step.
A PDF plan is read in this browser with Mozilla's pdf.js. Choose the page the plan is on; when its title block states a scale, such as 1:100 or 1/4" = 1'-0", the plan is set to it. That is only right for the original drawing at its own sheet size, so check it against one dimension you know.
Coverage is an estimate from the COST 231 multi-wall model: distance loss plus the loss of each wall and floor between an access point and a point on the plan. Wall and floor losses come from ITU-R P.2040-3 (08/2023) material properties for the constructions named, averaged over the angles a wall is crossed at, and are replaced by any figure you measure. Until you calibrate, loss with distance follows the ITU-R P.1238-9 site-general figures for a home or an office, which already allow for typical furniture, so the map errs on the weak side. People, appliances and the phone in your hand are not modelled, which is why the prediction can be calibrated against readings you take. The −67 dBm target is the figure Cisco's voice-over-WLAN design guidance uses for calls and video. "Hear each other" in the channel plan means above −82 dBm, the 802.11 preamble-detection threshold for a 20 MHz channel. Channel lists follow FCC Part 15 (United States) or ETSI EN 300 328, EN 301 893 and EN 303 687 (Europe).
Use it to decide where access points go and how many you need; confirm the result with a walk-through before drilling holes.
Your copy
Download everything saved in this browser, or restore a backup on this device.